Sunday, April 14, 2019
Wednesday, December 10, 2014
EURUSD to Move Higher until 18-20th Dec'14
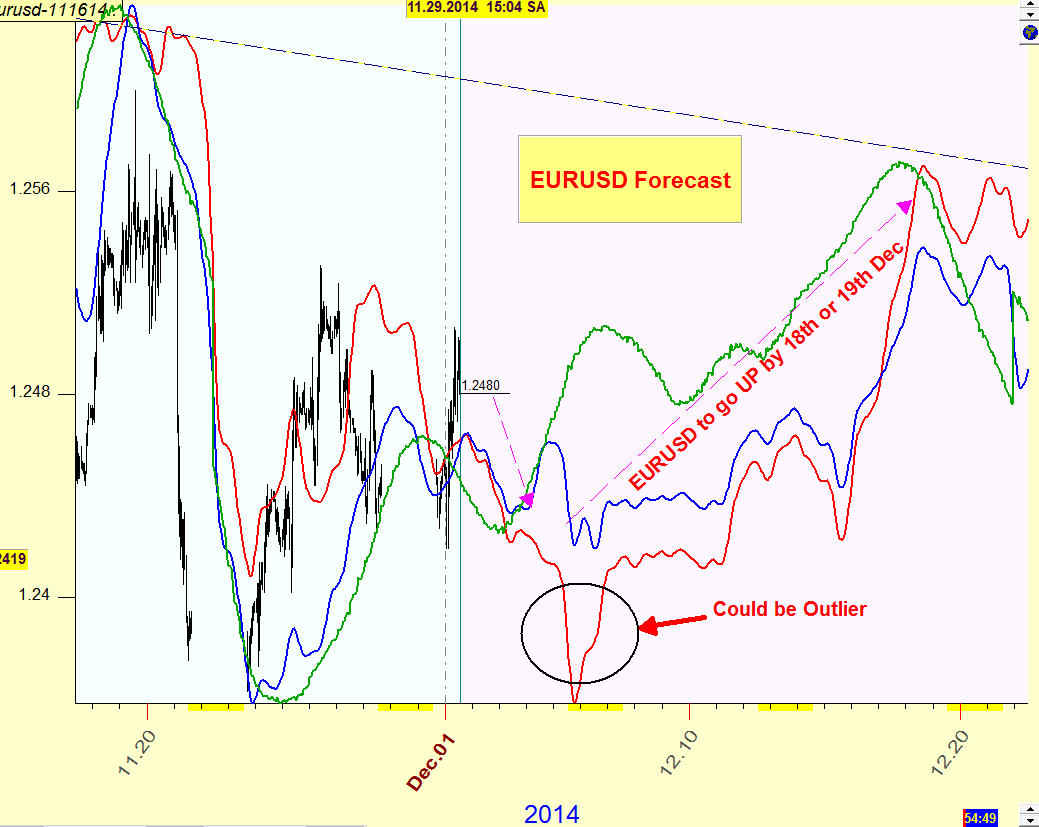
The EURUSD forecast for period 1st Dec - 20th Dec'14 was posted as shown in the chart. It was indciated that EUR was going to bounce after lows between 5th Dec - 7th Dec and going up into 18th -20th Dec'14
The actual performance as of 10th Dec'14 can be seen from another charted posted below the forecast.
Forecast
=======
Actual as of 10th Dec'14
==================
Abhay
The actual performance as of 10th Dec'14 can be seen from another charted posted below the forecast.
Forecast
=======
Actual as of 10th Dec'14
==================
Abhay
Thursday, January 2, 2014
EURUSD to move sideways to UP into 18th-20th Jan'14
EURUSD is completing the Down move that was forecasted into 1st - 3rd Jan'14. From here it will move Sideways to UP into 18th - 20th Jan'14. There may be some volatile moves expected in both direction but likely to stay UP into 18th - 20th Jan. See the charts attached below:
Forecast for Dec'13 - Jan'14
Actual for Dec'13 - Jan'14
Follow up action in 2014 Compared to Forecast
Forecast for Dec'13 - Jan'14
Follow up action in 2014 Compared to Forecast
Thursday, December 19, 2013
Forecast for EURUSD from NOV to DEC'13- Bounce into 18th-20th Dec then Decline
I had published the following forecast for EURUSD for Nov-Dec in some forums. This forecast had been generated about 3 months ago in Sep. Maroon color line was generated in Sep, Blue line was generated in Oct and the Red color line was generated in Nov. Below that is posted the actual correlation to the forecast.
Forecast
Actual Correlation to Forecast
Abhay
Forecast
Actual Correlation to Forecast
Abhay
Wednesday, September 18, 2013
Forecast for EUR over Oct - Nov'13
Euro is expected to begin down movement approx. from 23rd Sep'13 into 1st of Oct and will again bounce back to near or above highs of 18-23rd Sep. From there it will begin another bigger downward movement from about 20th - 22nd oct'13 into Nov.
For comparison to real action, see charts below :
Forecast
Actual
Forecast indicated TOP around 22nd Oct'13 and significant DROP into 1st Nov, basing around 11th Nov. Actual action turned out almost perfect trend, perfect timing...
Abhay
For comparison to real action, see charts below :
Forecast
Actual
Forecast indicated TOP around 22nd Oct'13 and significant DROP into 1st Nov, basing around 11th Nov. Actual action turned out almost perfect trend, perfect timing...
Abhay
Wednesday, April 10, 2013
GOLD Forecast For Mar'13 - May'13
I had recently published my Forecast of GOLD for Mar'13 - May'13 on some forums and I uploading here as well.,
Forecast
=======
The Red line, Green Line and Purple line are forecasting the trend for GOLD from Mid March to April'13 end. It indicated a drop around 28-29th Mar'13 and Support/Bounce around 4th Apr'13.
As seen from the chart below, the drop happened right after the time indicated by Blue ellipse and the bounce also happened exactly around the time where second Blue ellipse was marked.
A Drop in GOLD price was expected from 9th Apr-10th Apr and Turn around 11th Apr'13.
Actual
======
Forecast
=======
The Red line, Green Line and Purple line are forecasting the trend for GOLD from Mid March to April'13 end. It indicated a drop around 28-29th Mar'13 and Support/Bounce around 4th Apr'13.
Actual
=======
As seen from the chart below, the drop happened right after the time indicated by Blue ellipse and the bounce also happened exactly around the time where second Blue ellipse was marked.
A Drop in GOLD price was expected from 9th Apr-10th Apr and Turn around 11th Apr'13.
Actual
======
GOLD Forecast Performance Since Sep'12 - Mar'13
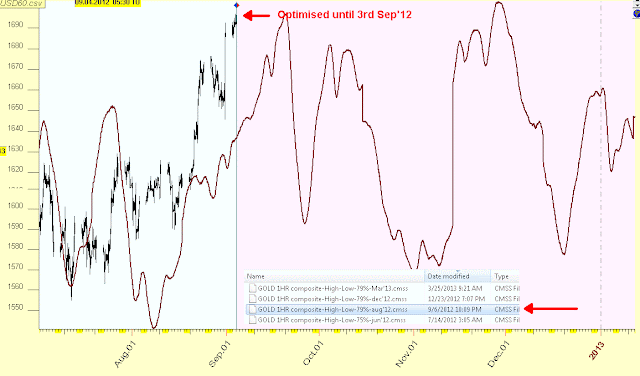
I am publishing here the GOLD trend forecast that was generated in SEP'12 and I will compare how it has performed since then,
Forecast
=======
Actual
=====
Red Line shows the Forecasted Trend published in Sep'12 and GOLD performed almost exactly as it was forecasted.
Red Line shows the Forecasted Trend published in Sep'12 and GOLD performed almost exactly as it was forecasted
Subscribe to:
Comments (Atom)


